Drag Polar#
This section builds a drag polar model for the example airplane. During conceptual design stage, a simple drag polar model is used, written as
where the first term denotes parasitic drag (computed in previous section) and second term represents induced drag. The \(A\) stands for aspect ratio and \(e\) refers to oswald efficiency factor. The aspect ratio is set to 8, which was assumed during initial weight estimation. The oswald effciency factor is computed using (Raymer equation 12.48):
Once required parameters are known, \(C_D\) can be computed for a given value of \(C_L\). The model developed in lift section is used for computing \(C_L\) for a range of angle of attack. Then, \(C_L\) values are used for computing \(C_D\).
Below code block computes drag polar for the example airplane in clean (cruise) configuration:
import matplotlib.pyplot as plt
import numpy as np

A = 8
e = 1.78*(1 - 0.045*A**0.68)-0.64
alpha = np.linspace(-5, 13, 100)
alpha_CLzero = -1.0
CLalpha = 5.0
fs = 12

CL = CLalpha * (alpha - alpha_CLzero) * np.pi / 180
CD0 = 0.03363
CDi = CL**2 / np.pi / A / e
CD = CD0 + CDi

fig, ax = plt.subplots()
ax.plot(CD, CL, "k-")
ax.plot([0.0, 0.1], [0.0, 1.24], "k--")
ax.scatter(0.065, 0.8, zorder=10, s=30)
ax.set_xlabel("$C_D$", fontsize=fs)
ax.set_ylabel("$C_L$", fontsize=fs)
ax.set_title("Drag polar for example airplane - cruise configuration", fontsize=fs)
ax.annotate("$L/D$ max", (0.065,0.7), fontsize=fs, ha="left", va="center")
ax.grid()
plt.tight_layout()
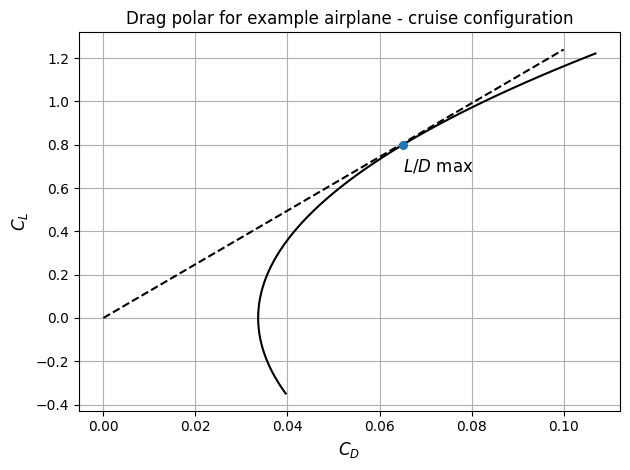
As indicated in the above plot, the point where line from origin is tangent to drag polar refers to maximum \(L/D\). The example airplane has a maximum \(L/D\) of 12.31. This concludes the drag polar section. In next section, high-lift devices are sized, and the drag polar and lift model are updated accordingly. The corresponding drag polar in takeoff and landing configuration are also plotted.